
Z-score

Background:
Calculates the z-score of a selected numerical field. The user has the option of having the analysis performed based on the population standard deviation or the sample standard deviation.
Documentation:
Script: z-score.iss
Author: Brian Element - brian.element@ideascripting.com
Date: August 16, 2012
Purpose: This script creates a new field in your database and will calculate the z-score for the selected field.
Per Wikipeadia a z-score "indicates by how many standard deviations an observation or datum is above or below the main".
In a normal bell-shaped curve approximately 95% of your observations would fall to within two standard deviations on the mean. 99.7% of your observations would fall within three standard deviations of your mean. The z-score is a good indicator of how closely an observation would be to the mean, the smaller the number the closer it is to the mean.
When starting the script you will be given the following dialog.
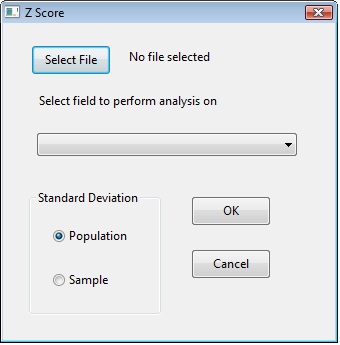
You must first select the file you wish to perform the analysis on and then select a numeric field to have the z-score calculated on. You have a choice of either the population or the sample standard deviation. You would generally select population if you have the complete population to review, if you only have a sample of the population you would select sample standard deviation.
The script creates an additional field called Z_SCORE. The closer the Z_SCORE is to 0 the closer it is to the mean (which can be found in the field statistics). If the Z_SCORE is +/- 1 then that means that the observation is one standard deviation from the mean, if it is +/- 2 it would be two standard deviations and so on. The larger the Z_SCORE the farther the observation is from the mean, this can be used to look for unusually large or small amounts.
Document PDF: